Weather Dashboard

What’s the best season?

Well, there’s no single answer - China is a gigantic country, almost the size of Europe!

My personal favourite is Spring, I choose March to May whenever I can. But it can be a bit cold and foggy in some places.

A lot of people say Spring and Autumn, which is fairly universal in about 70% of the country. But I wouldn’t paint everywhere with the same brush and rule out the other seasons entirely. 
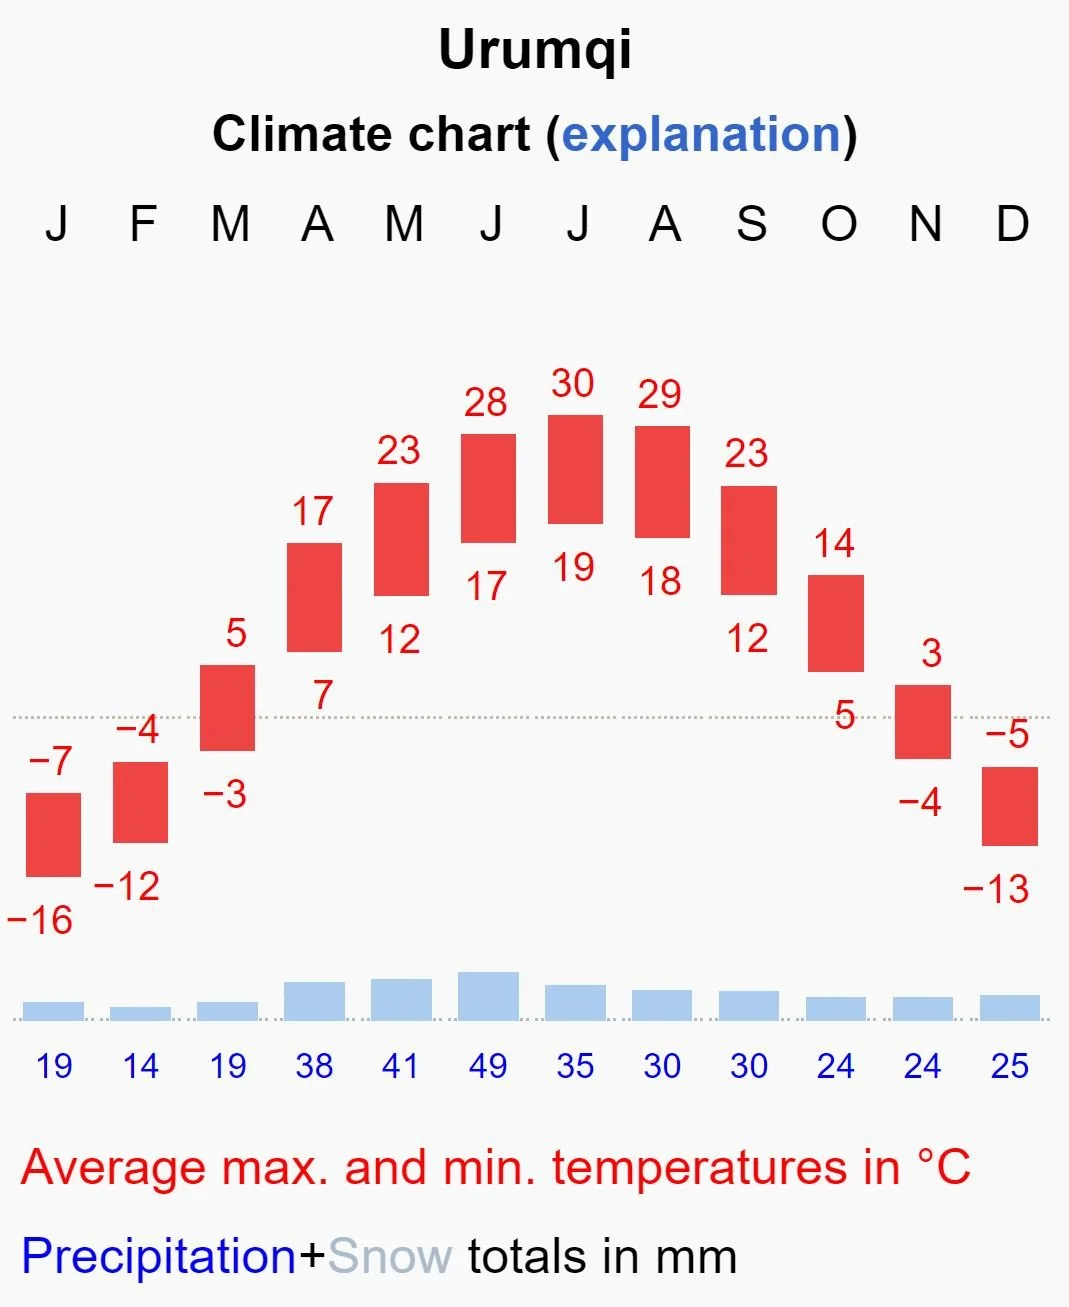
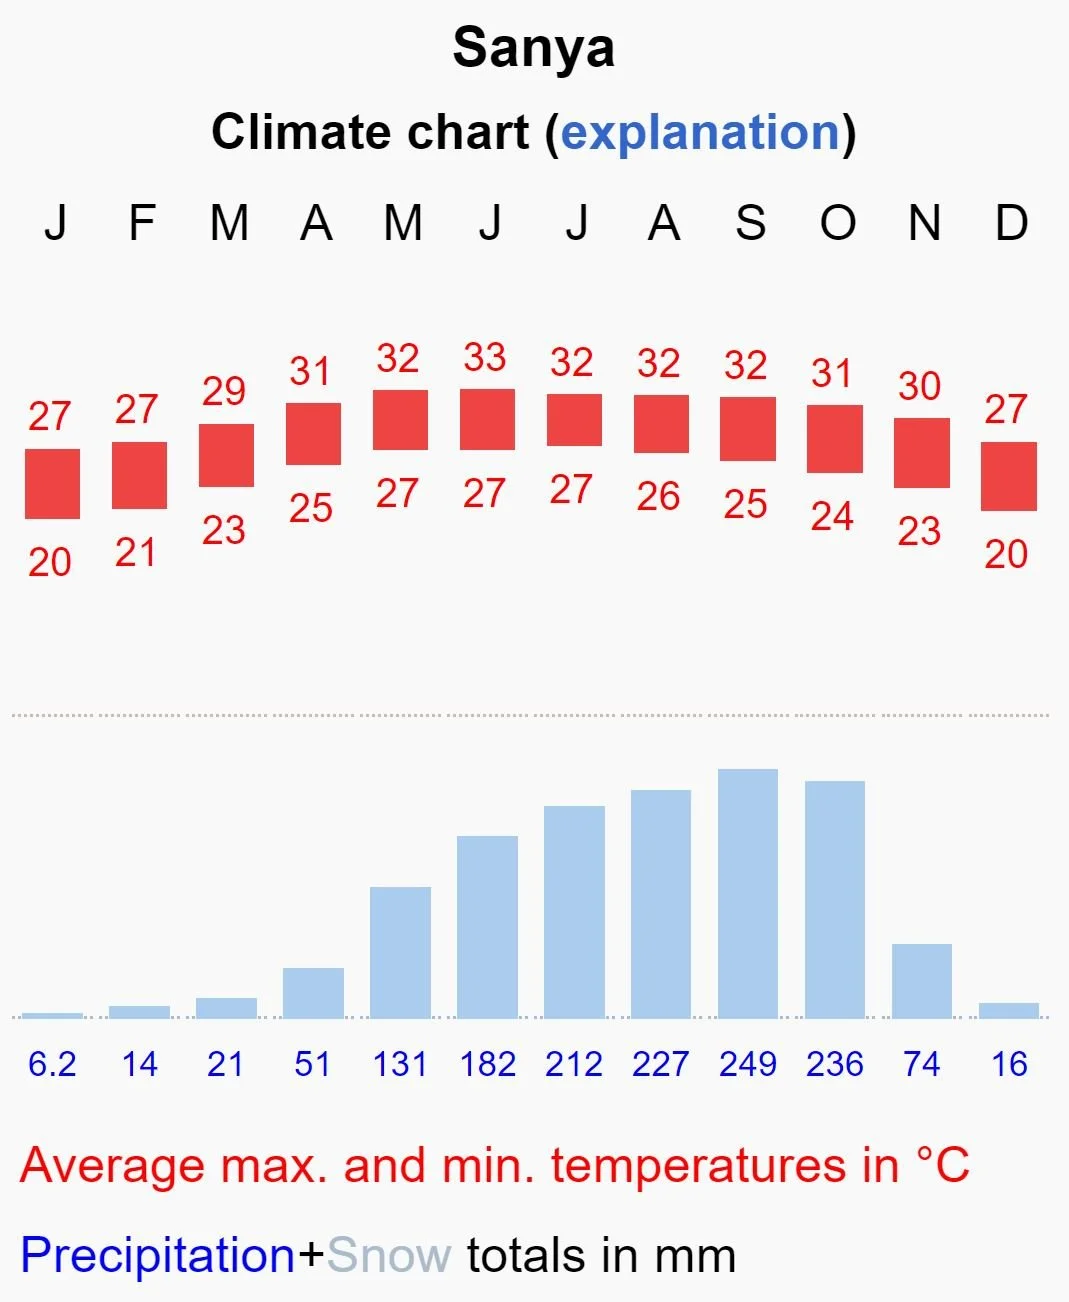
For example, winter is perfect in Sanya and summer is recommended in Urumqi.

Months with high temperatures AND high rainfall are the worst for me as most days are unpleasant and sweaty.

I find myself showering morning and evening. 🚿

So don’t make this mistake if you hate hot weather. 🥵

Cold is better than hot.

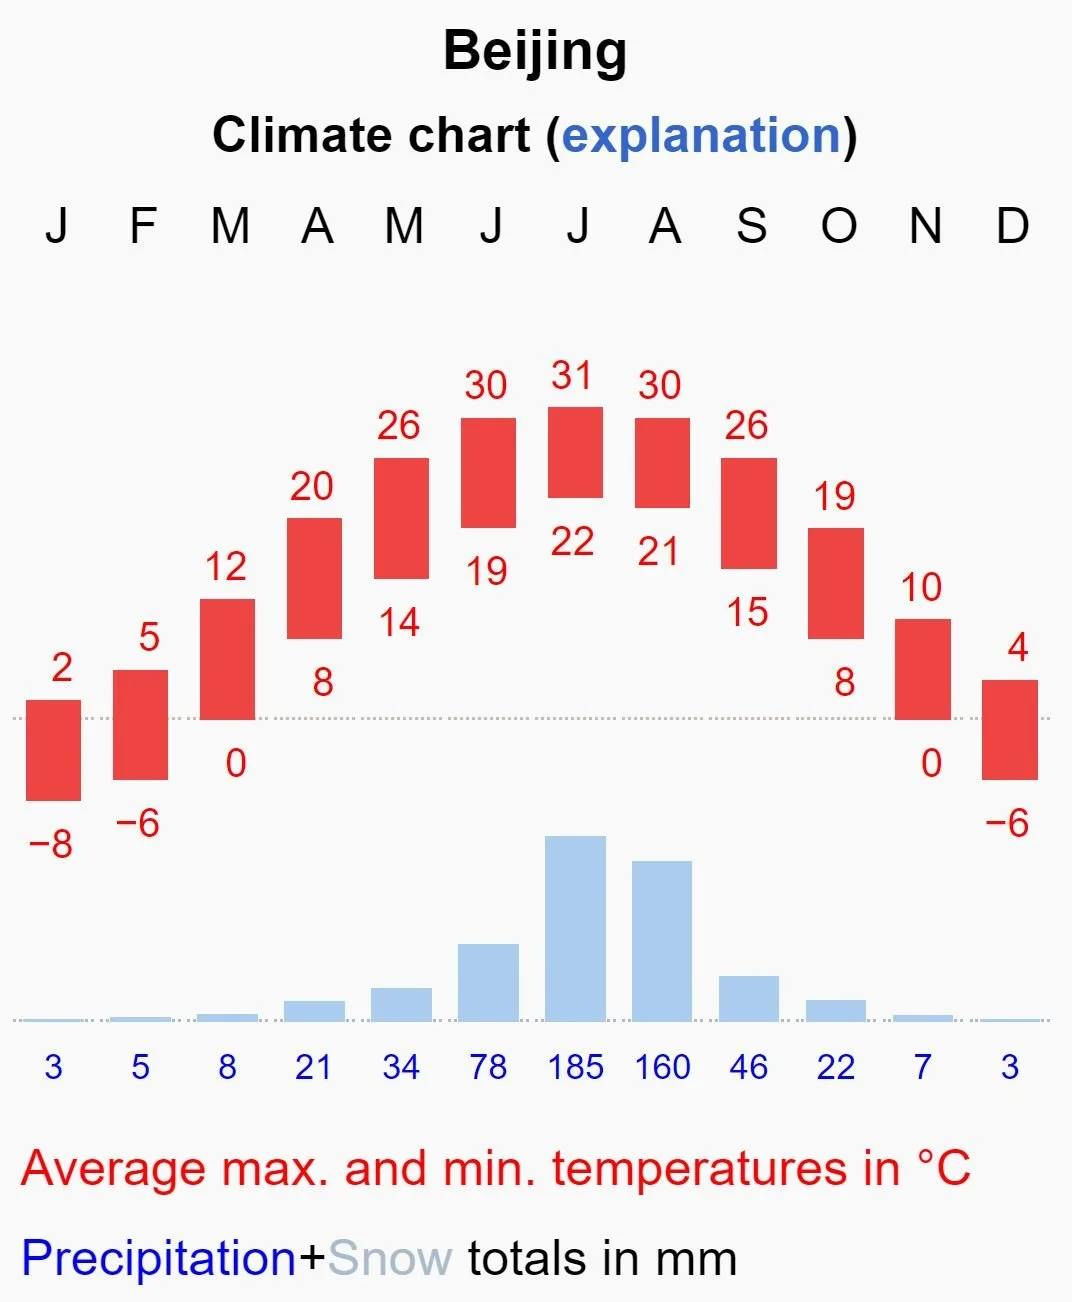
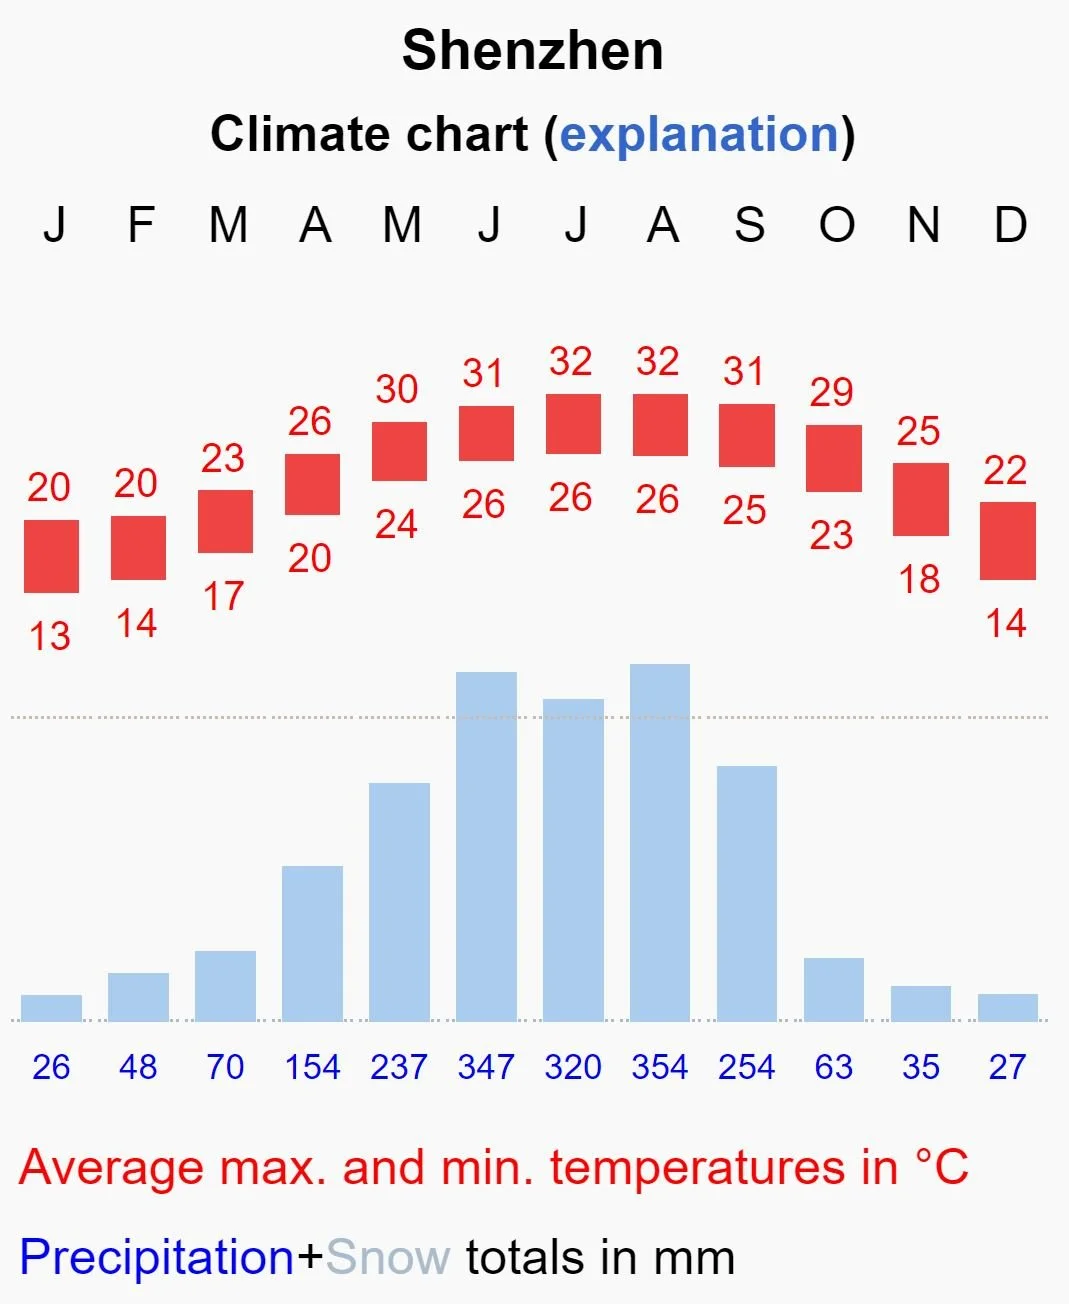
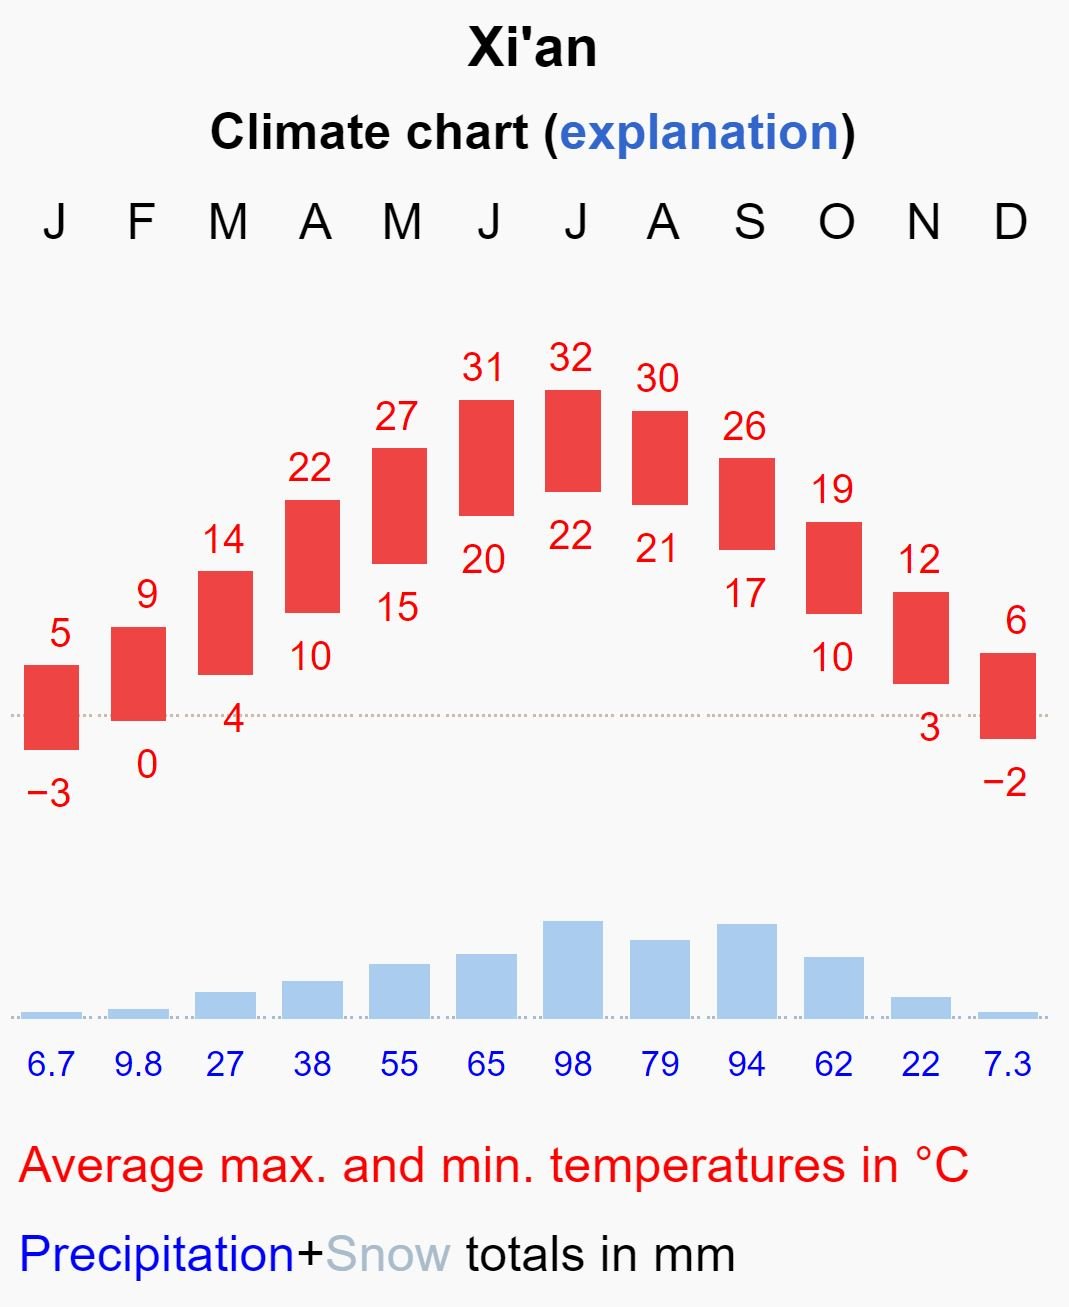
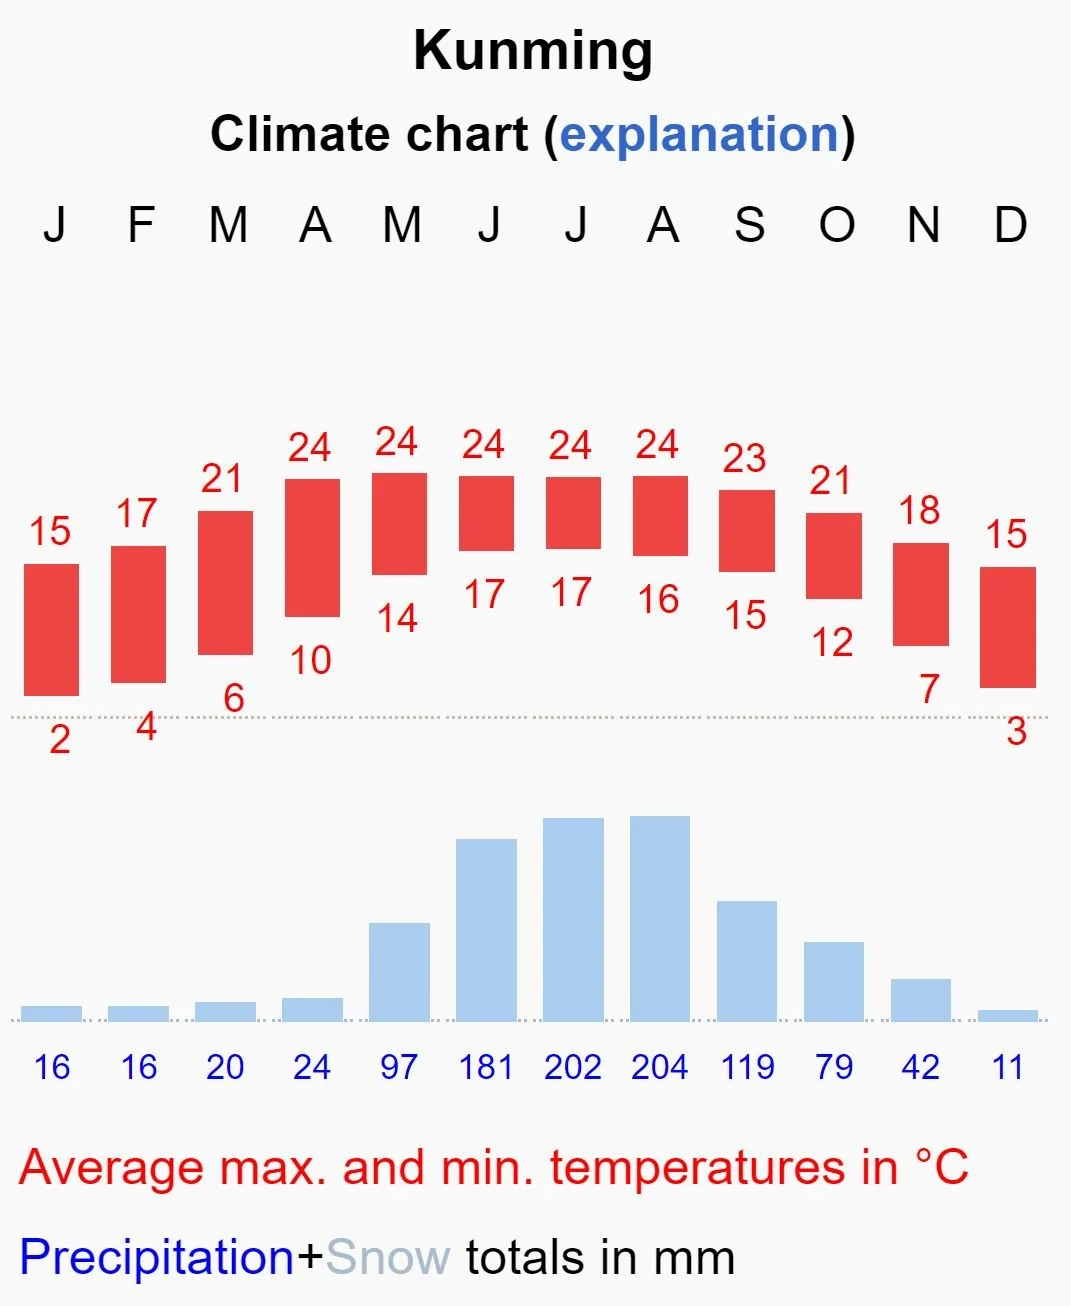
I’ve collected some climate charts below for major cities around China. 📊

Take a look. Hopefully it’ll help you narrow down your dates. 📅

It’s very simple. First row is January to December, left to right.

Red bars show historical average maximum and minimum temperatures for that month in Celsius.

Hotter summer days are more common in recent years.

Blue bars shows rainfall in mm. High rainfall is typically linked to high humidity, especially in South China.

When there’s regular rainfall, it’s harder to get amazing pictures in most places. Personally when rainfall gets above 200mm in a single month, it gets annoying for me (ironically I’m from South China).

A climate chart for Beijing showing average maximum, minimum temperatures in Celsius, and precipitation in millimeters for each month.
Climate chart for Shanghai, showing monthly average maximum temperatures in red and average minimum temperatures in black, with precipitation totals in blue and snowfall in gray, January through December.
Climate chart for Shenzhen showing average maximum and minimum temperatures in degrees Celsius from January to December, with red bars and numbers indicating max temperatures and black numbers for min temperatures. Below, a blue histogram displays monthly precipitation totals in millimeters.
A climate chart for Chongqing showing monthly maximum and minimum temperatures in Celsius, with a bar graph indicating monthly precipitation in millimeters. It also includes snow totals and a link to an explanation.
Climate chart of Lhasa showing average maximum and minimum temperatures in Celsius, with a bar graph of precipitation and snow totals in millimeters for each month.
Climate chart for Sanya showing monthly average maximum and minimum temperatures in Celsius with red bars and purple bars, and monthly precipitation and snowfall totals in millimeters with a blue bar. The chart indicates temperatures ranging from 20°C to 33°C, with the highest temperatures in July and August, and monthly precipitation varying from 6.2 mm to 249 mm.
A climate chart of Hong Kong showing average maximum and minimum temperatures in Celsius, with red numbers indicating values in red squares and blue numbers indicating total precipitation in millimeters, plus snowfall totals in gray.
Climate chart showing temperature and precipitation data for Nanjing. Red bars depict average maximum and minimum temperatures in Celsius, with values ranging from -1°C to 32°C across months. Blue bars represent total monthly precipitation in millimeters, varying from 24mm to 193mm. The chart includes an explanation link at the top.
A climate chart for Xi'an showing average maximum and minimum temperatures in Celsius throughout the year. The chart also includes blue bars representing monthly precipitation in millimeters and light gray snow totals.
Climate chart for Harbin showing average maximum and minimum temperatures in Celsius with colored bars, and precipitation totals in millimeters with a blue histogram. The chart indicates temperature trends throughout the year, with the coldest months in January and December, and the warmest in July and August.
Climate chart for Guangzhou showing average maximum and minimum temperatures in Celsius and total precipitation and snow in millimeters across months from January to December.
Climate chart for Chengdu showing average maximum temperatures in red and precipitation in blue, with months labeled from January to December.
Climate chart for Urumqi showing average maximum and minimum temperatures in degrees Celsius by month, with red bars representing temperature highs and lows, and blue numbers indicating precipitation totals in millimeters at the bottom.
Climate chart for Kunming showing monthly average maximum and minimum temperatures in Celsius, precipitation, and snow totals, with months listed from January to December.